Flight delays have become a harsh reality for air travelers across the United States. Whether you’re heading home for the holidays or jetting off on a business trip, certain airports have earned a reputation for keeping passengers waiting far longer than expected. Recent data from the Department of Transportation shows that nearly one in five flights experienced delays during 2024, making airport selection more crucial than ever for punctual travelers.
Dallas/Fort Worth International Airport (DFW) – Texas
Based on the latest available data from the Bureau of Transportation Statistics, the airport with the most flight delays is the Dallas Fort Worth International Airport (DFW) in Texas. The main causes for its consistent delays are the region’s frequent severe weather, air traffic control (ATC) issues, and the fact that it’s a major international hub. As the nation’s busiest connection hub, Dallas/Fort Worth is expected to lead in disruptions this year, with over a third of December flights likely delayed. The airport’s massive size means that even minor disruptions can cascade into major delays throughout the day. Dallas Fort Worth International Airport (DFW) has a total average delay of around 37.9 minutes, which puts it in the third position on the list. Departure delay is around 19.2 minutes and taxi-out delay time is 18.7 minutes.
San Francisco International Airport (SFO) – California
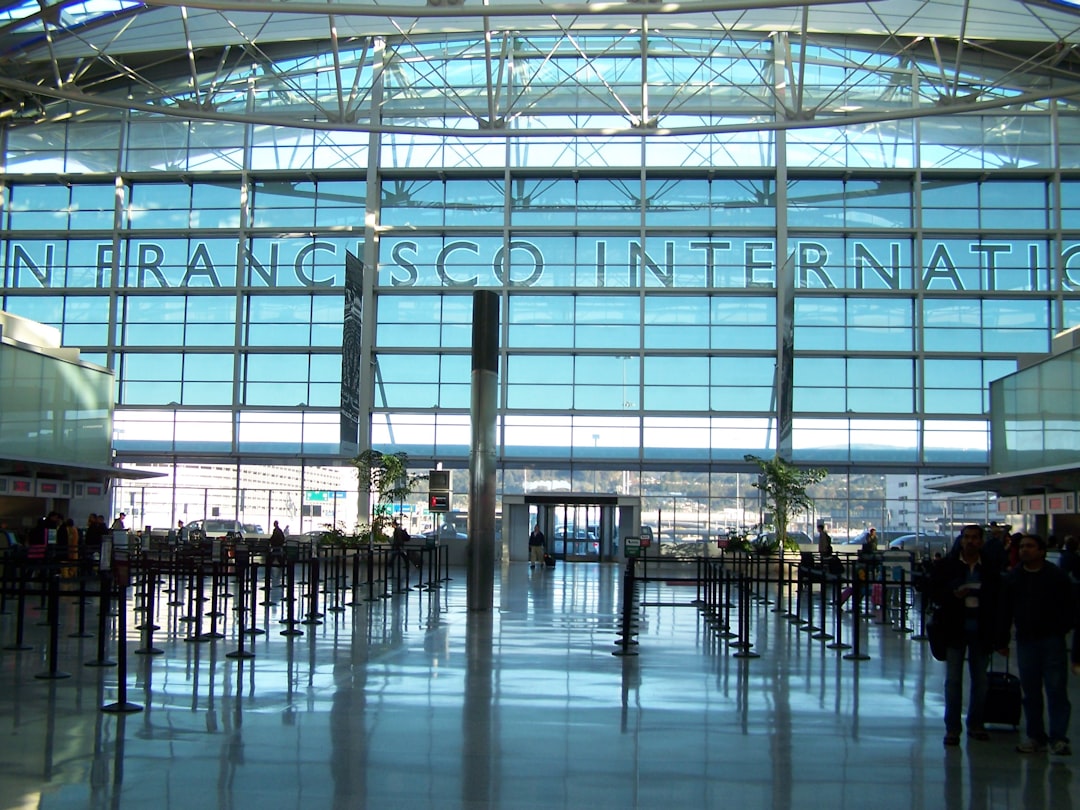
San Francisco International (SFO) ranks among airports with high delay rates, with approximately 25% of flights delayed, making it one of the most problematic airports for punctual travelers. About 60% of delayed flights arriving at San Francisco International Airport (SFO) are caused by weather – specifically, cloud cover and fog in the famously misty city. San Francisco is also notable for parallel runways that are so close together, air traffic controllers stagger landings on days when visibility is low. On clear days, SFO can land around 60 planes every hour. During periods of low visibility, only 30 planes per hour are allowed to land. This dramatic reduction in capacity creates bottlenecks that ripple through the entire system.
Washington Reagan National Airport (DCA) – Washington D.C.
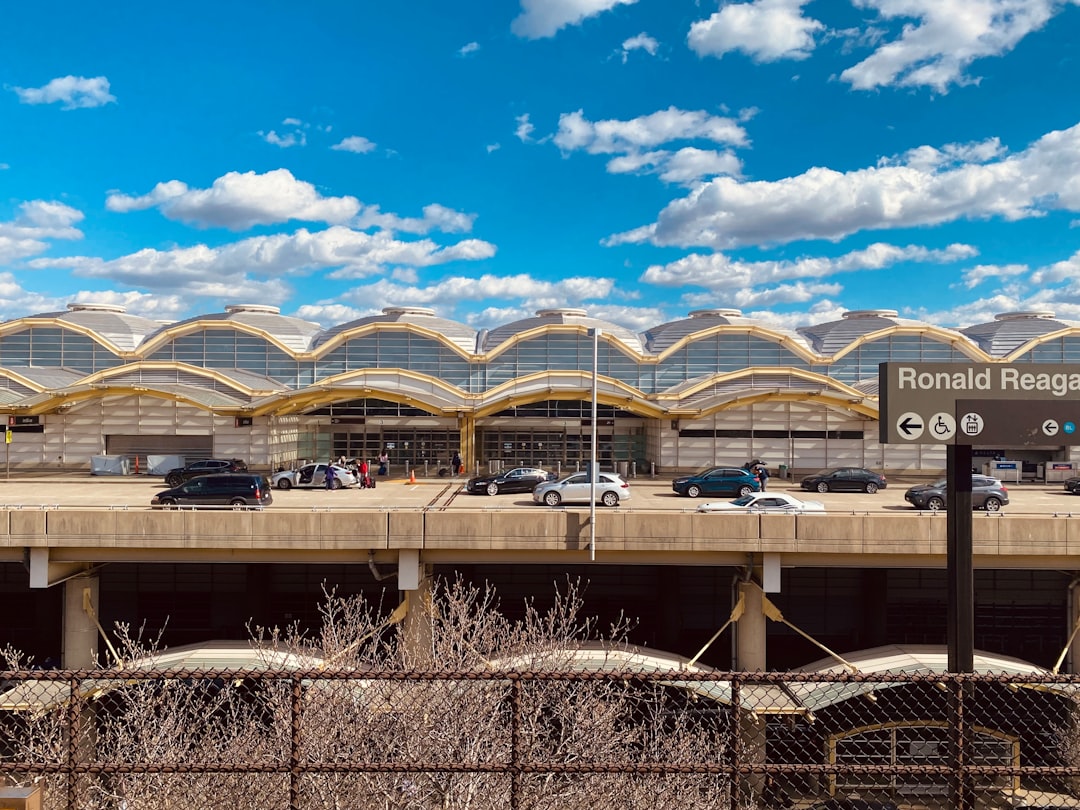
Washington Reagan National (DCA) consistently ranks among airports with high delay and cancellation rates in the country – making it the least reliable major airport overall. Following it on the list of worst airports for delays are the Ronald Reagan Washington National Airport (DCA) and Denver International Airport (DEN). The airport’s proximity to restricted airspace around the nation’s capital creates unique operational challenges that other airports don’t face. Complex flight patterns and strict security protocols add another layer of complication to an already challenging environment.
Newark Liberty International Airport (EWR) – New Jersey
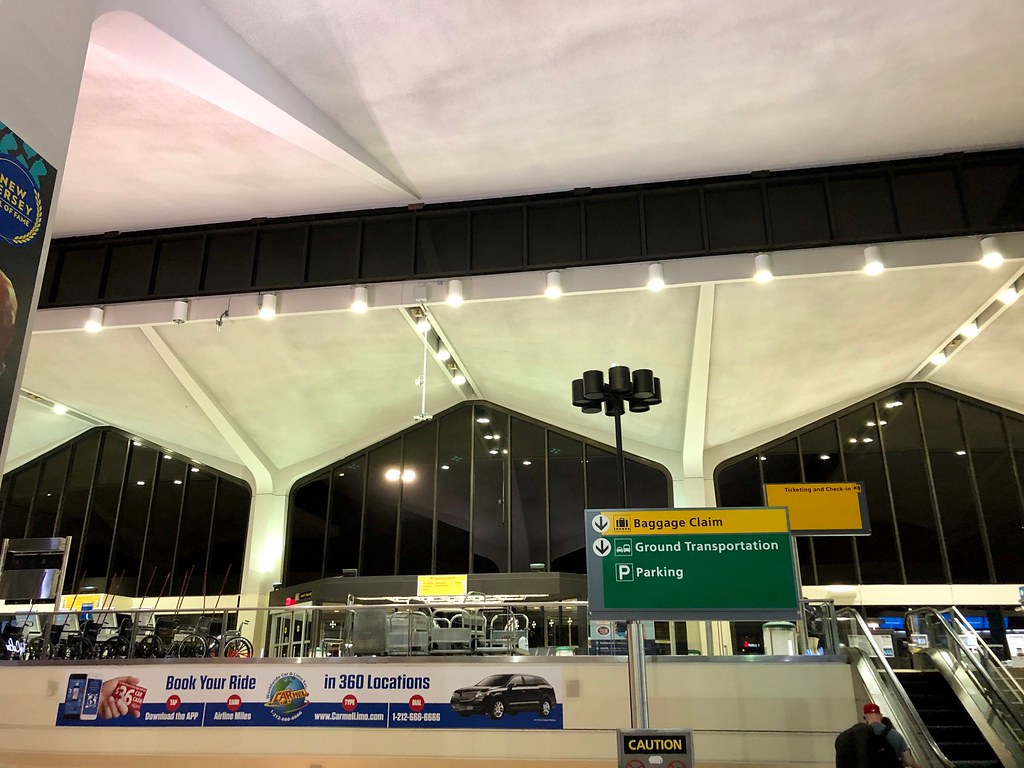
Airport delays have received increased attention recently due to ongoing issues at Newark Liberty Airport, including several radar and communications systems outages since late April. These issues and the delays they have caused have prompted the Federal Aviation Administration (FAA) to propose limiting the number of arrivals and departures the airport handles. The airspace around New York City is the most congested in the country, so it’s no surprise to see Newark Airport in neighboring New Jersey make the list of the top 10 most delayed airports in the U.S. Indeed, the No. 1 cause of delays at EWR in 2024 was related to the National Aviation System (NAS), a broad set of disruptions that include airport operations, heavy traffic volume, and air traffic control.
Chicago O’Hare International Airport (ORD) – Illinois
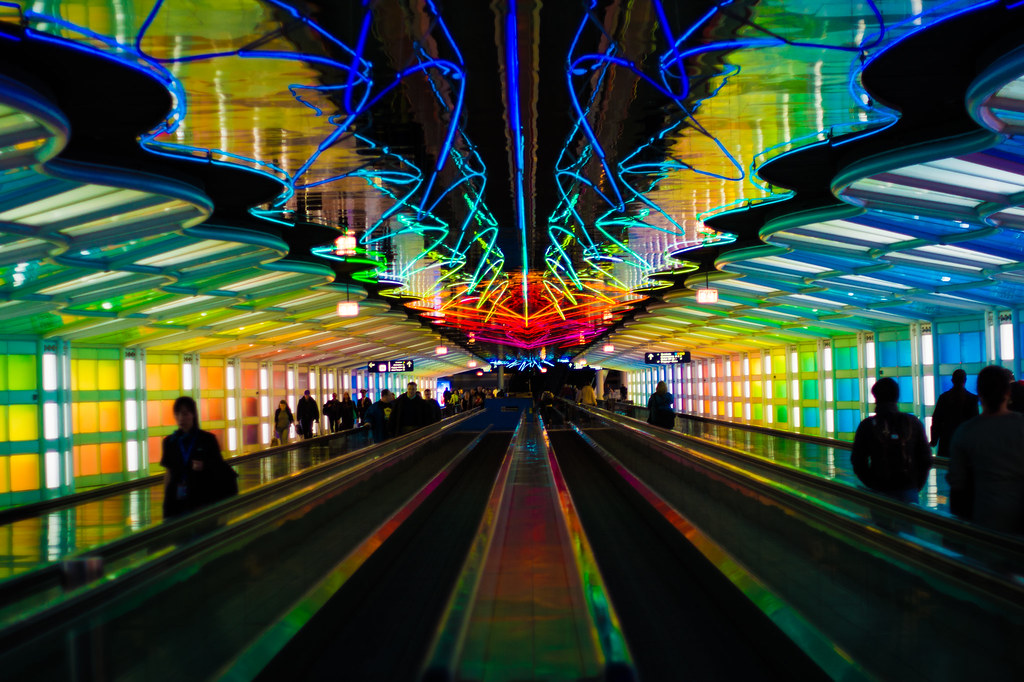
The award for the highest number of weather-delayed flights goes to Chicago O’Hare International Airport (ORD). On average, the weather delays 28,000 flights into O’Hare each year. You can blame snow and ice (Chicago sees 28 snowy days each year, on average), frequent thunderstorms, wind, and fog. Close behind is Chicago O’Hare International Airport (ORD), with an average wait time of 31.7 minutes. U.S. citizens wait 27.3 minutes on average, while non-citizens wait 40.3 minutes. The combination of harsh Midwestern weather and heavy traffic volume makes O’Hare particularly challenging during winter months.
Philadelphia International Airport (PHL) – Pennsylvania
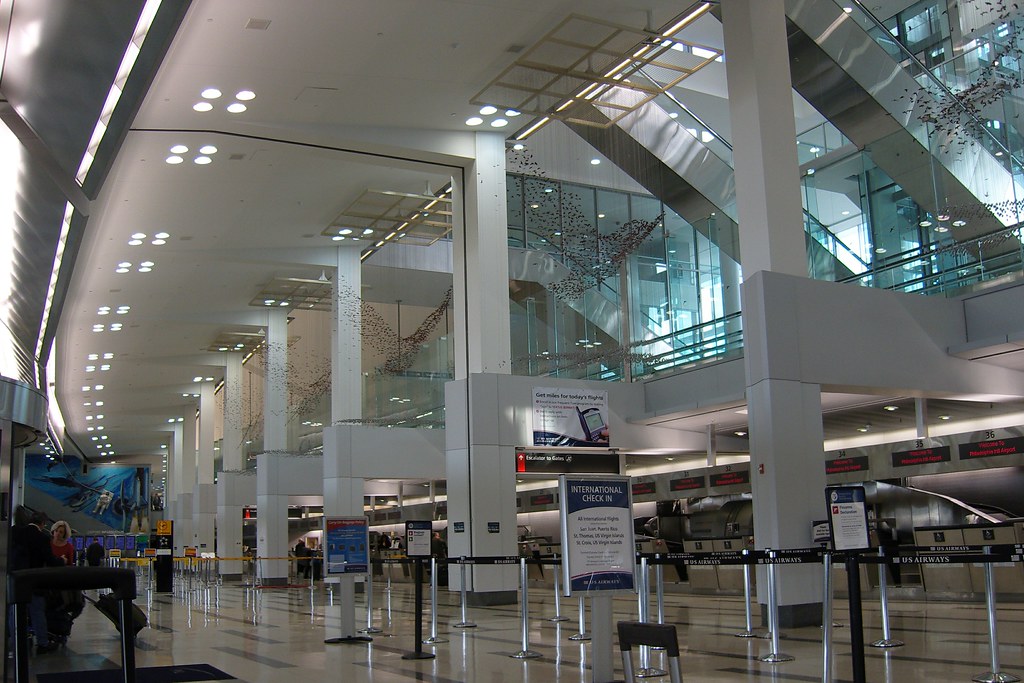
In case you’re wondering, Philadelphia International has the longest wait time for departure delays, with delayed flights taking off 81.23 minutes later than scheduled on average. In the Fourth place, we have Philadelphia International Airport (PHL), the total average delay time is around 36.9 minutes which is just 0.3 minutes more than the fifth position. In the Fourth place, we have Philadelphia International Airport (PHL), the total average delay time is around 36.9 minutes which is just 0.3 minutes more than the fifth position. The departure delay is around 15.8 minutes and the taxi-out delay is around 21.1 minutes. They put 60% in on-time performance, and that’s not something that the airport is responsible for. Nobody can help the weather … we’re in the busiest air spaces in the world, not only the country.
Miami International Airport (MIA) – Florida
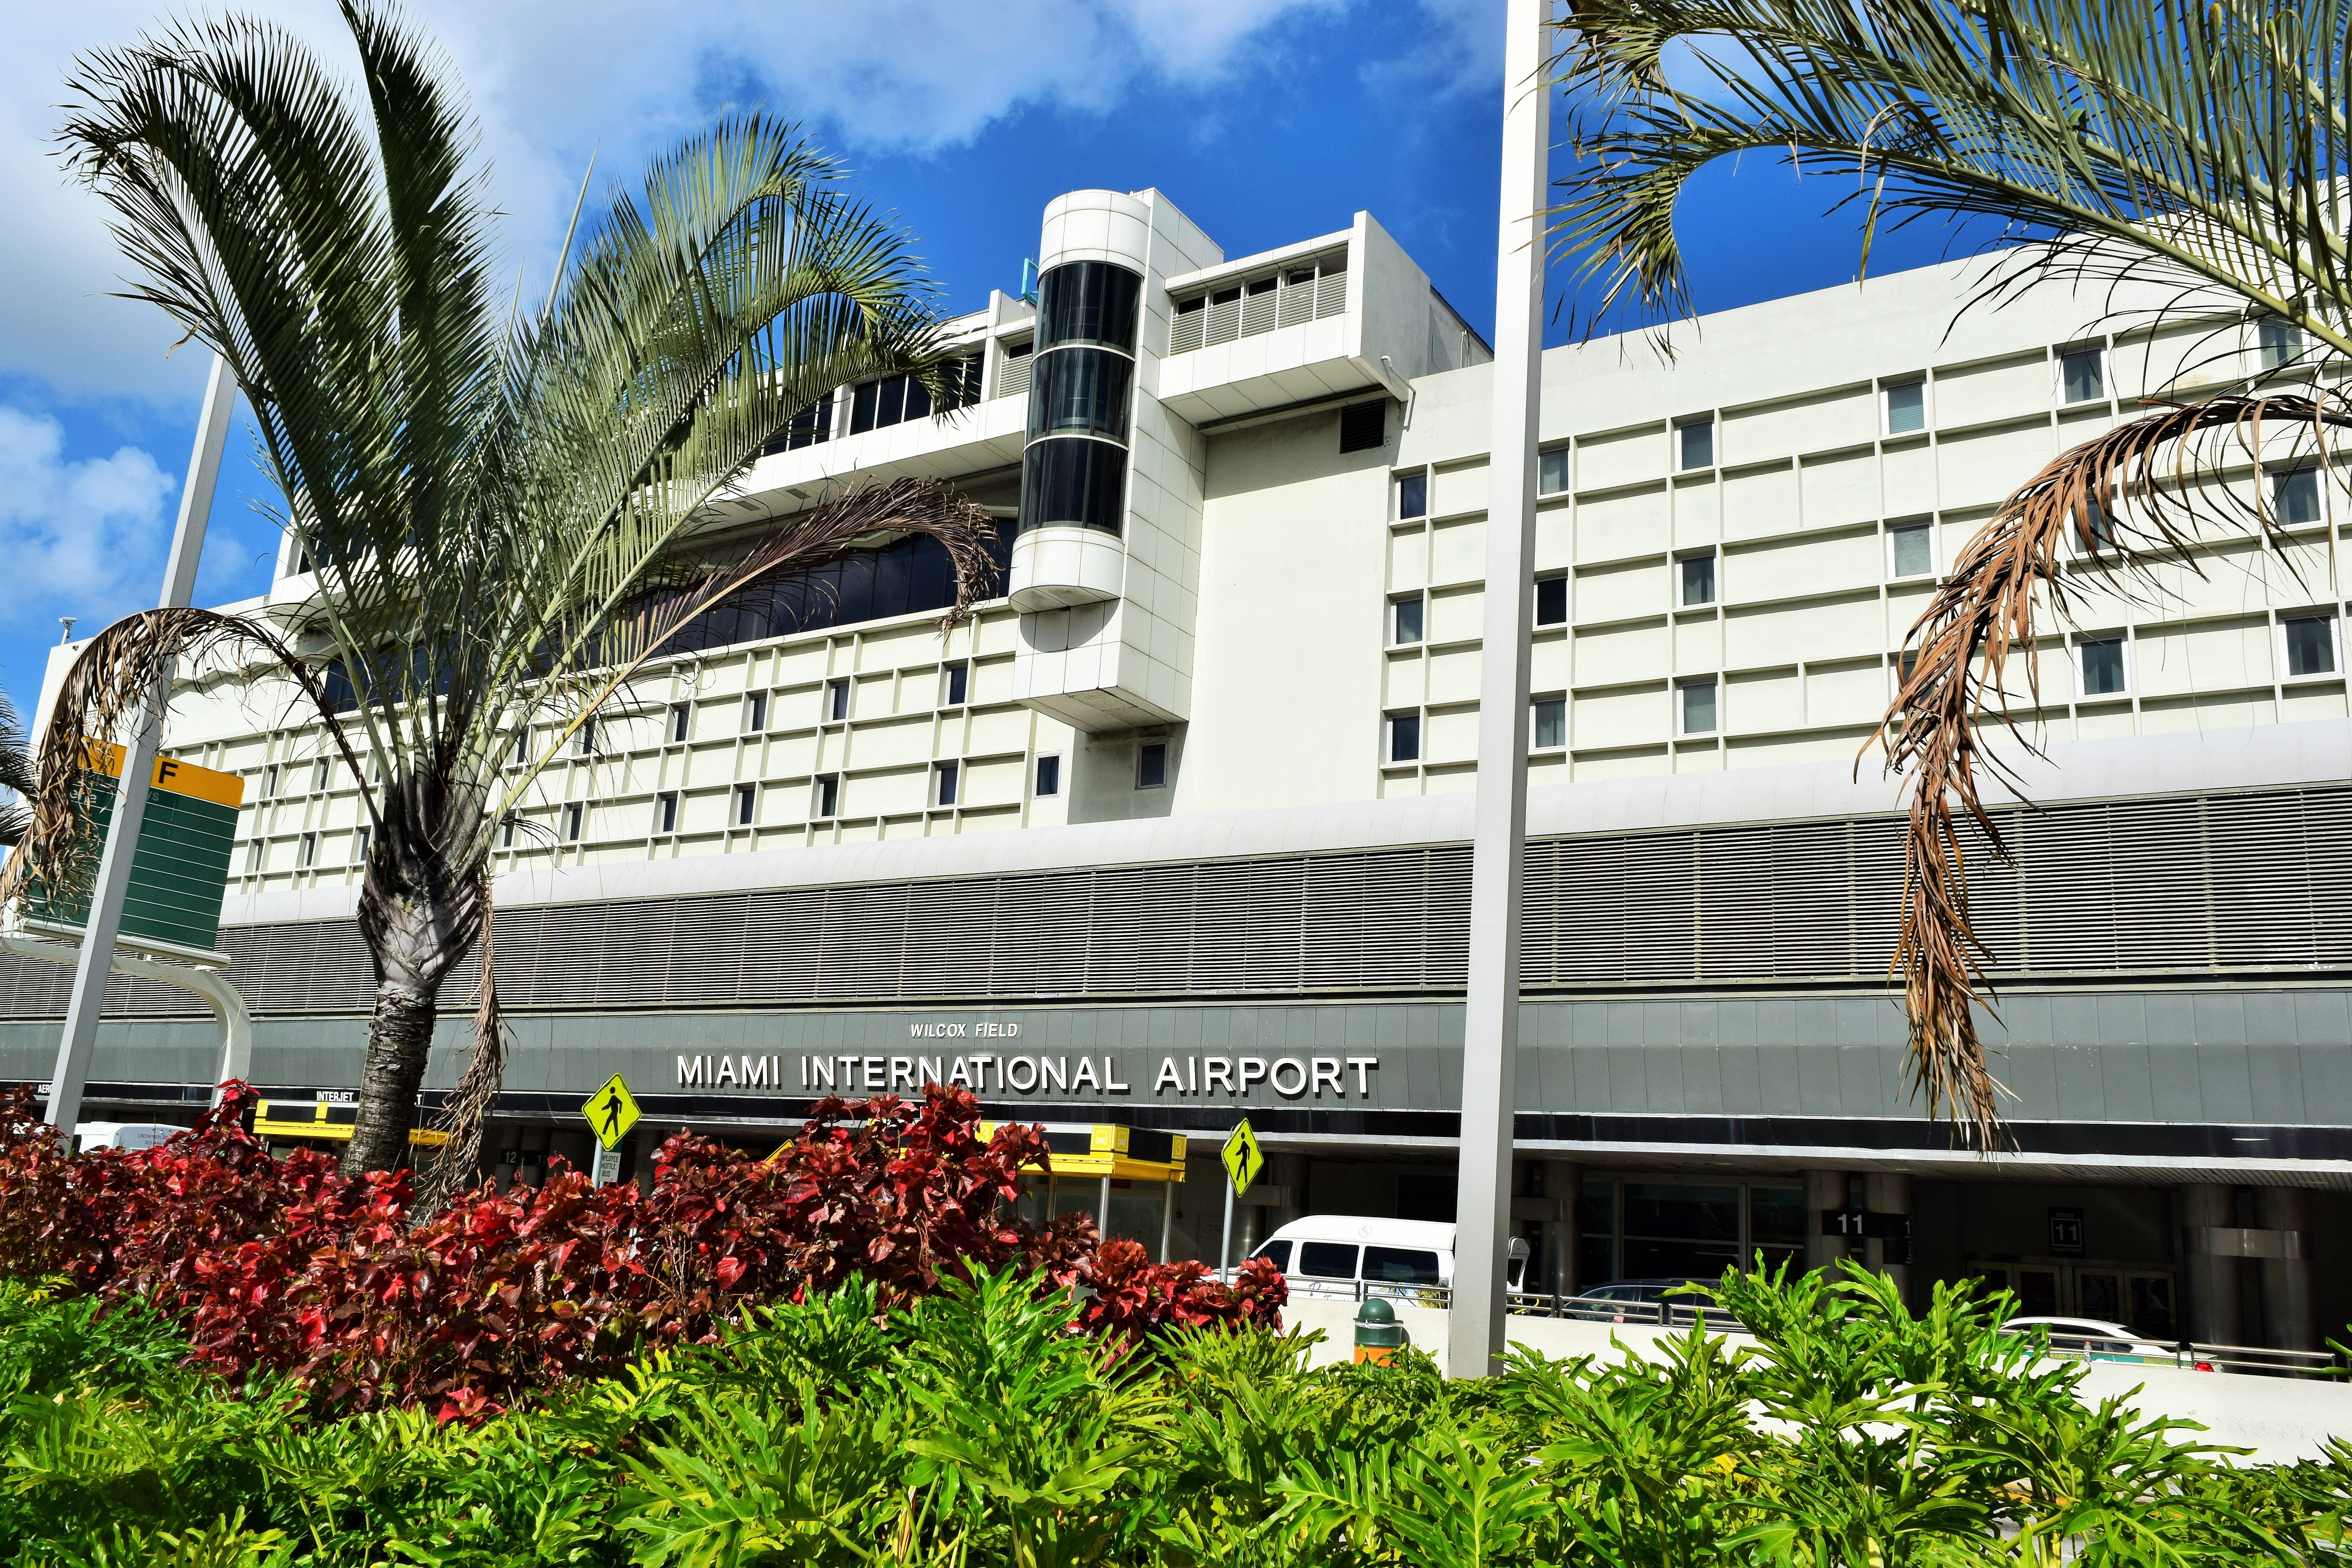
Miami saw significant challenges in 2024, ranking among the worst airports for delays and cancellations. With a large number of flights to Latin America and the Caribbean, operational challenges and seasonal weather often add to the disruption. Miami (MIA), a main hub for American Airlines and the airport with the most diverse number of international airlines in the country, also made the list for both high delays and cancellations, signaling ongoing operational challenges at this major U.S. hub. Florida dominates the delay rankings, with five airports (PBI, FLL, TPA, MCO, MIA) making the top 10 for highest delay percentages. The combination of tropical weather patterns, heavy international traffic, and complex logistics makes Miami particularly vulnerable to cascading delays.
The reality of modern air travel means that delays are becoming increasingly common across the United States. According to a separate report released Thursday by the Public Interest Research Group (PIRG) Education Fund, which utilizes BTS data, complaints against U.S. airlines reached record levels, with data showing over 61,000 complaints in recent years. Smart travelers know that arriving extra early at these seven airports isn’t just good advice. It’s essential survival strategy in today’s chaotic aviation landscape.