
Ask most people to name the world’s richest country and the United States comes up almost automatically. It has the largest economy on the planet, a dominant currency, and headline-grabbing corporate giants. Yet total economic size and average individual wealth are two very different measurements, and once you divide national output by population, the picture shifts dramatically.
When economists calculate GDP per capita, a handful of small, specialized economies consistently rise to the top while larger nations slide down the list. The countries that lead this ranking in 2026 share a common thread: compact populations paired with outsized financial, technological, or resource-driven industries.
Luxembourg: Europe’s financial powerhouse

Luxembourg has topped global GDP per capita rankings for years, and 2026 is no exception. By GDP per capita (nominal), Luxembourg leads with roughly $154,000 per person, followed by Ireland and Switzerland. That figure is staggering given the country’s size, and it comes from a very specific economic engine rather than broad industrial output.
Luxembourg is a global financial hub with just 660,000 people, and its favorable tax regime and thriving banking sector make it a magnet for capital flows and foreign investment. Its dominant financial services sector manages over €5 trillion in assets, making it the world’s second-largest investment fund center after the US, specializing in cross-border fund administration, private banking, and insurance services. The scale of money moving through the country simply dwarfs its population, which is exactly why the per-person figure looks so extreme.
Ireland: multinational money and a modified measuring stick

Ireland’s rise up the wealth rankings over the past two decades has been remarkable. With a projected GDP per capita of $135,247, Ireland secures a place near the very top, reflecting how smart tax policy and global connectivity can catapult a small nation to global prominence. Over the past decade, Dublin has evolved into a tech and innovation powerhouse, hosting headquarters for Apple, Google, Meta, and hundreds of other multinationals.
The catch is that Ireland’s headline number does not fully reflect what ordinary residents earn. Irish GDP data is subject to material distortion by the tax planning activities of foreign multinationals, which is why the Central Bank of Ireland created “modified GNI” in 2017 as a more appropriate statistic, later adopted by the OECD and IMF. In other words, the raw per-capita figure captures corporate accounting as much as it captures actual national prosperity.
Switzerland: stability, precision, and private banking
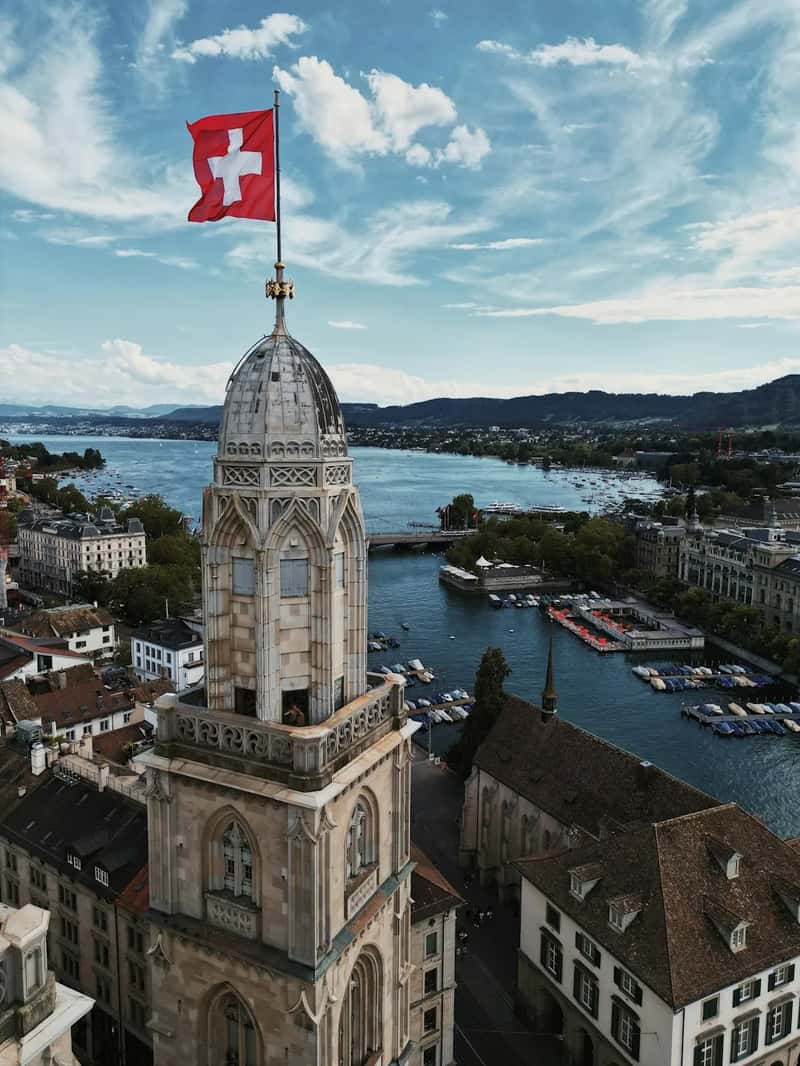
Switzerland rarely makes headlines the way tax-haven microstates do, yet it consistently ranks among the wealthiest nations per person. Depending on the data source and exchange rate at the time, its nominal GDP per capita sits somewhere in the range of $110,000 to $120,000, a level that has held remarkably steady over recent years. While Switzerland’s nominal GDP per capita is roughly $118,000, its PPP-adjusted figure is closer to $91,000, reflecting the country’s genuinely high cost of living.
What sets Switzerland apart from some of its tax-haven neighbors is the depth of its underlying economy. Switzerland combines political stability with an established private banking industry, alongside genuinely productive precision manufacturing and pharmaceutical sectors. That combination of financial services and physical industry gives its wealth a sturdier foundation than headline figures alone might suggest.
Singapore: Asia’s high-income hub

Singapore’s ascent has been one of the most closely watched stories in global economics. The IMF confirmed Singapore as the world’s second-richest nation in 2026 by nominal GDP per capita, at approximately $108,000 per person, marking the first time any Asian economy has surpassed $100,000 in nominal terms. In purchasing power parity terms, Singapore is even stronger, with a PPP GDP per capita of approximately $162,000, reflecting that its high incomes operate in a relatively affordable domestic service economy compared to Western Europe.
The country’s transformation did not happen overnight. When the city-state became independent in 1965, one-half of its population was illiterate, and with virtually no natural resources, Singapore pulled itself up through hard work and smart policy. Today it draws wealthy residents and firms from across the region, in part because Singapore is an affluent fiscal haven where capital gains and dividends are tax-free.
Norway: oil wealth managed for the long term

Norway’s wealth story is less about financial engineering and more about disciplined resource management. Norway is Western Europe’s top producer and major global exporter of petroleum and natural gas, which are primary drivers of national wealth, alongside rich reserves of fish, forests, and minerals. Rather than spending oil revenue as it comes in, the country has taken a notably cautious approach.
Instead of immediately spending all oil revenues, the government channels nearly all petroleum profits into its Government Pension Fund Global, the world’s largest sovereign wealth fund, valued at over $2 trillion in 2025. A strict fiscal rule dictates that only the expected return, around 3 percent, from the fund’s capital can be used annually in the national budget, which prevents economic overheating and preserves the fund for future generations. That kind of restraint is rare among resource-rich economies and helps explain why Norway’s prosperity has proven more durable than many oil-dependent states.
Qatar: gas riches translated into national income
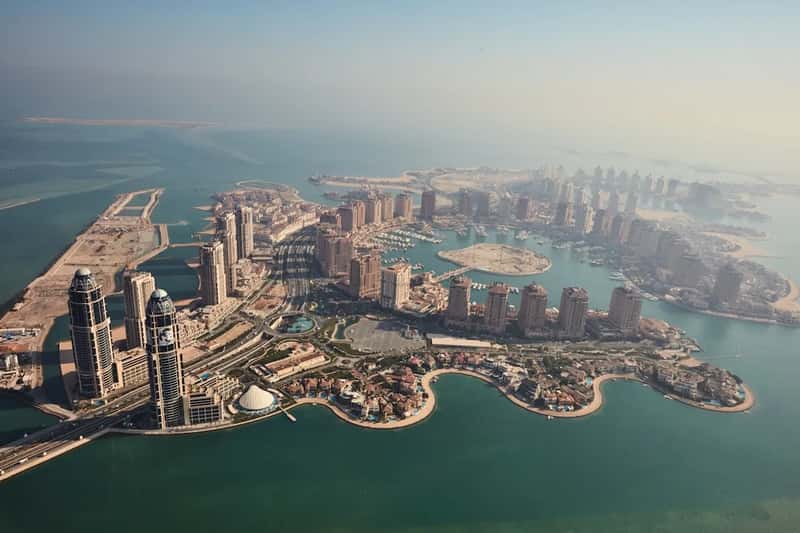
Qatar’s wealth is built almost entirely on hydrocarbons, but the scale of its reserves puts it in a different league. Qatar ranks among the world’s richest countries by GDP per capita, with wealth anchored in vast natural-gas reserves and a leading LNG industry. The country has weathered volatile energy markets and regional instability while maintaining a resilient economic base.
Recent IMF projections point toward accelerating growth. Growth is projected by the IMF to ramp up in the years ahead, to about 5.6% in 2026 and 8% in 2027. It is worth noting that this wealth is unevenly distributed among residents, since a large migrant labor force, making up over 80 percent of Qatar’s workforce, earns far less and is excluded from the welfare story those headline figures suggest.
Where the United States actually lands

None of this means the United States is poor by any reasonable standard. It simply means that spreading a $31 trillion economy across more than 340 million people produces a very different per-person number than spreading Luxembourg’s economy across roughly 700,000 residents. The United States, at roughly $92,900 per person, only recently entered the per-capita top ten due to its large population, alongside Denmark and the Netherlands around $80,000.
That places the US comfortably among the world’s high-income nations, but well behind the six countries profiled above. The gap is not a sign of American economic weakness so much as a reflection of scale: a country with hundreds of millions of people simply divides its wealth more thinly than a financial city-state or an oil-rich nation with a small citizenry.
Why these rankings shift from year to year

GDP per capita is not a fixed law of nature. It moves with currency values, corporate accounting decisions, and commodity prices, which is why rankings can reshuffle noticeably within a single year. GDP per capita does not consider differences in the cost of living, and results may vary greatly from one year to another based on exchange rate fluctuations, which may change a country’s ranking even when living standards barely move.
This is particularly true for the small, trade-exposed economies at the top of the list. A stronger dollar can knock a European nation down several spots without any change in its actual output, while a weaker dollar can do the opposite. Readers comparing rankings across different sources should expect some variation, since figures depend on whether nominal or purchasing-power-adjusted data is used, and on which quarter’s exchange rates apply.
The takeaway on national wealth
The six economies covered here, Luxembourg, Ireland, Switzerland, Singapore, Norway, and Qatar, arrive at their wealth through very different paths: banking, corporate tax policy, precision industry, trade hubs, and natural resources. What unites them is scale, or rather the lack of it. Small populations combined with concentrated high-value activity produce per-person figures that large, diversified economies like the United States simply cannot match on this particular measure.
None of this diminishes the size or influence of the American economy, which remains the largest in the world by total output. It does, however, serve as a useful reminder that “richest” depends entirely on what you are measuring, and that the answer looks quite different once you start dividing by population instead of counting in trillions.