Housing affordability is easy to feel and hard to compare. The most widely used yardstick is the median multiple, which divides a city’s median house price by its median pre tax household income. The higher the number, the less affordable it is for the typical household to buy a home.[1]
The 2026 edition of the Demographia International Housing Affordability report uses third quarter 2025 data. It covers 96 major housing markets in eight countries: Australia, Canada, China, Ireland, New Zealand, Singapore, the United Kingdom and the United States.[1] The ten markets below sit at the very top of that list.
1. Hong Kong

Hong Kong tops the 2026 report. Its median multiple is 14.1.[2] In practical terms, a typical home costs roughly fourteen years of the typical household’s pre tax income.
The city has held the top spot for a long time. It was the least affordable market in the report for 14 years running as of the 2025 edition.[3] The picture has eased a little, though. The multiple was 16.7 in 2023 and 20.8 before the pandemic in 2019.[3]
Other rankings use different methods and can look harsher. A 2026 Forbes ranking cited by Statista puts Hong Kong’s home prices at more than 16 times pre tax household income.[4] Whichever measure you use, it comes out first.
2. Sydney
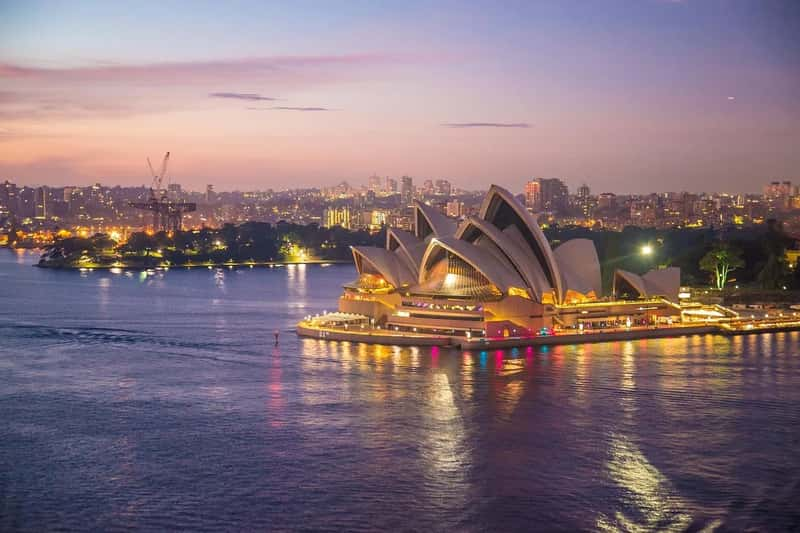
Sydney sits a hair behind Hong Kong. This year it nearly matched Hong Kong, with a median multiple of 14.0.[2] That makes it the second least affordable market out of the 96 surveyed.
The ranking isn’t a one year blip. The 2026 report says Sydney has been among the three least affordable markets in 16 of the past 17 years.[5] Few large cities have stayed this expensive for this long.
3. San Jose

San Jose is the most expensive major market in the United States. It was the least affordable major US housing market in 2025.[2] Its median multiple is 11.3.[2]
That is a slight improvement on the year before. The 2025 edition had it at 12.1.[6] The city sits in the heart of Silicon Valley, so incomes are high, but prices are higher still. One 2026 analysis of US metros lists a median home price of $1,920,000 against a median income of $164,801.[7]
4. Adelaide
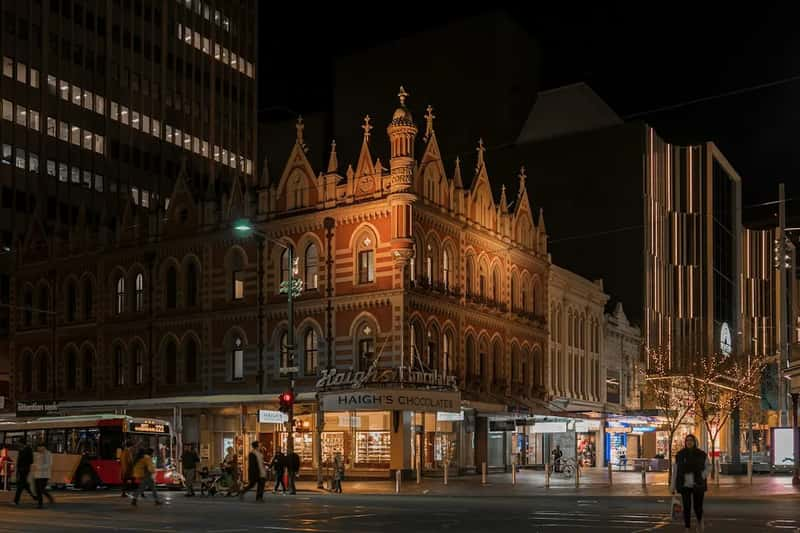
Adelaide is the surprise of the top five. The 2026 report puts it at 11.2.[2] That is fourth worst, ahead of Vancouver and Los Angeles.
It’s also the smallest of Australia’s big markets. The previous edition noted that even Adelaide endures an impossibly unaffordable median multiple.[8] In that edition it scored 10.9, which placed it ahead of San Francisco and Honolulu.[9]
5. Vancouver
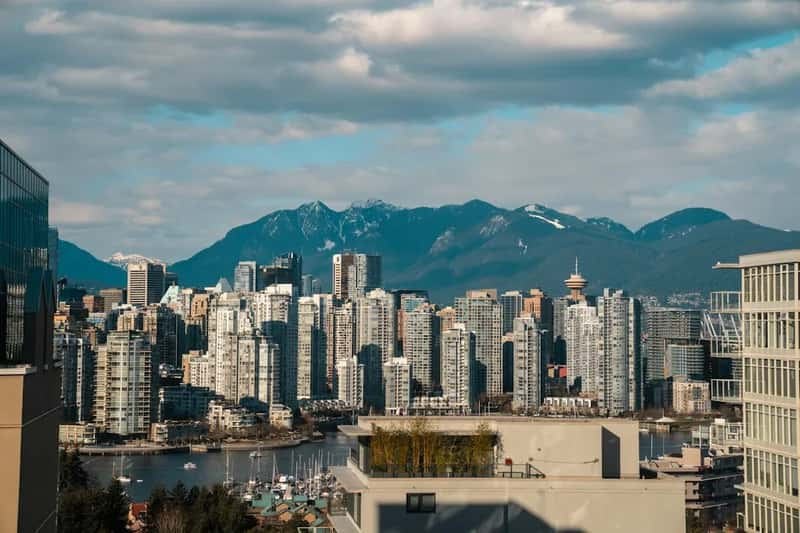
Vancouver is Canada’s least affordable market, at 10.8 in the 2026 report. It ranks fifth, just behind Adelaide.[2] The 2025 edition had it higher, at 11.8.[6]
The gap inside Canada is wide. The range between its most and least affordable markets grew from 1.5 median multiple points in 1971 to 7.2 points in 2025.[2] Edmonton shows the other end of the scale, tied for third best affordability internationally at 3.6.[2]
6. Los Angeles

Los Angeles comes in sixth with a median multiple of 10.7. It follows Vancouver in the 2026 ranking.[2] The year before, it scored 11.2 and ranked fifth.[6]
California as a whole stands out. The 2025 report counted four California markets as impossibly unaffordable.[6] Los Angeles was the second least affordable market in the US that year, behind San Jose.
7. Honolulu
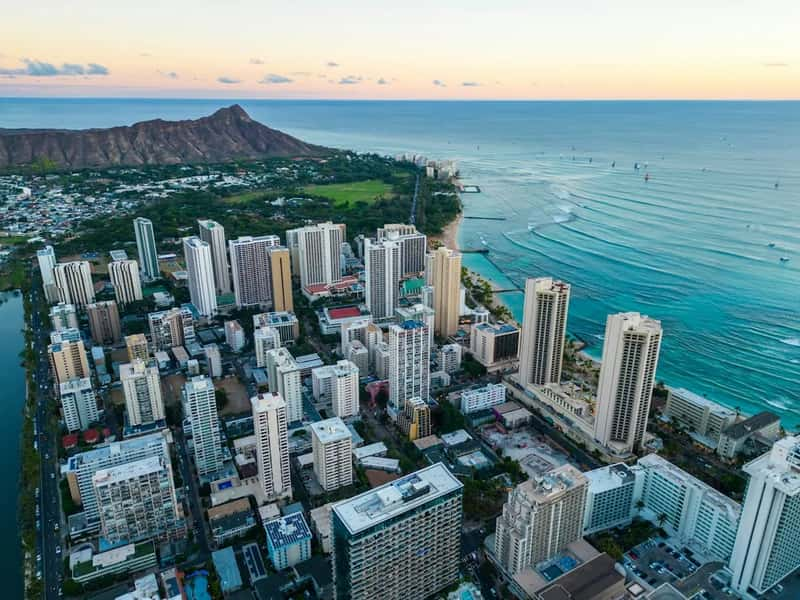
Honolulu rounds out the 10 and over group at 10.4. It is listed beside Los Angeles and San Jose among the US markets with the highest multiples.[2] The 2025 edition put it slightly higher, at 10.8.[6]
Island geography limits how much land can be built on, and that tends to push prices up. Hawaii shows up elsewhere too. One 2026 index of US metros ranks Kahului-Wailuku, on Maui, as the least affordable metro.[10]
8. Brisbane
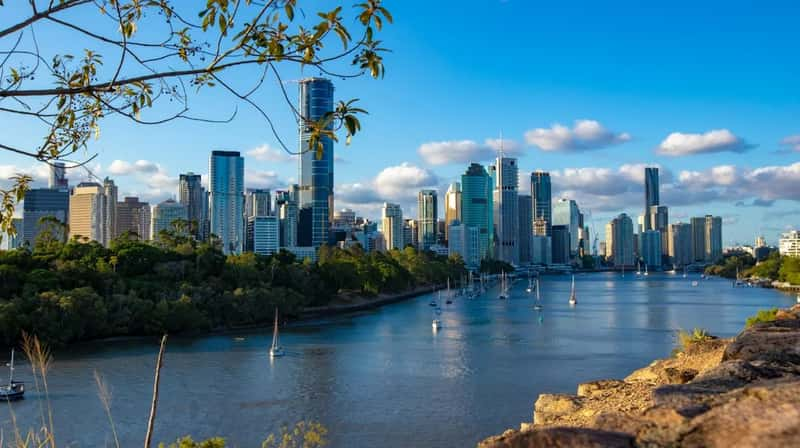
Brisbane has climbed fast. At 9.9 it set a record high in the Demographia survey, ranking 89th least affordable.[2] The 2025 edition had it at 9.3.[11]
That puts it in the same bracket as Australia’s biggest cities. The report’s top group is defined by a multiple of nine or higher, which falls into the impossibly unaffordable category.[3] Brisbane now sits well inside it.
9. Melbourne
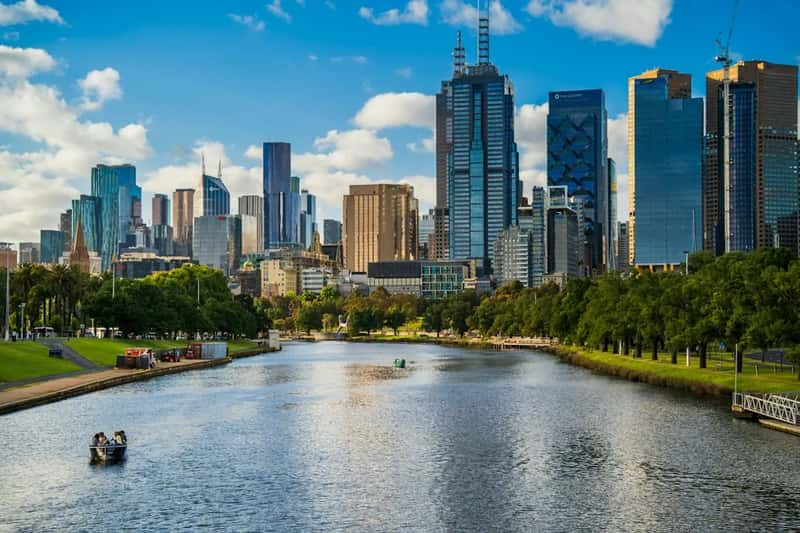
Melbourne holds ninth place with a median multiple of 9.5. That makes it the 88th least affordable market in the report.[2] It is also the third Australian city in the top ten, with Sydney and Adelaide ahead of it.
It has eased a little, since the 2025 edition showed it at 9.7.[6] Even so, it remains deep in impossibly unaffordable territory. Australia now places four of its major markets in the group, counting Brisbane.
10. San Francisco

San Francisco closes out the list at 9.4. The report says it had a median multiple of 9.4 in 2025.[2] A year earlier it scored 10.0.[6]
It’s a reminder that the ranking measures price against income, not price alone. Incomes in the Bay Area are high, yet homes cost far more than local pay can easily support. San Francisco still sits above the nine point line that defines impossibly unaffordable.
The Ranking at a Glance
In order, the 2026 Demographia list reads Hong Kong at 14.1, Sydney at 14.0, San Jose at 11.3, Adelaide at 11.2 and Vancouver at 10.8. Los Angeles follows at 10.7, then Honolulu at 10.4, Brisbane at 9.9, Melbourne at 9.5 and San Francisco at 9.4. All ten are rated impossibly unaffordable.
Four Australian cities, four US cities, one Canadian city and Hong Kong make up the group. Figures for other years or from other publishers, such as Forbes, use different methods and can differ.