
For tens of millions of Americans, the morning commute has become less of a routine and more of an endurance test. Roads that once moved at a reasonable clip now lock up for hours, stealing time that could be spent with family, at work, or simply at rest. The gridlock is not a new story, but the scale of it in 2025 and 2026 has reached levels that are genuinely alarming – and the data backs that up completely.
The typical U.S. driver lost 49 hours to traffic congestion in 2025, an 11 percent increase from the year before – more than a full work week, and amounting to roughly $894 in lost time per driver. Across the entire country, that added up to nearly 4.7 billion hours lost to traffic, costing the economy close to $86 billion. These are not abstract numbers. They represent real people sitting in real cars, watching their dashboards tick and their patience run thin.
Chicago: America’s Most Congested City
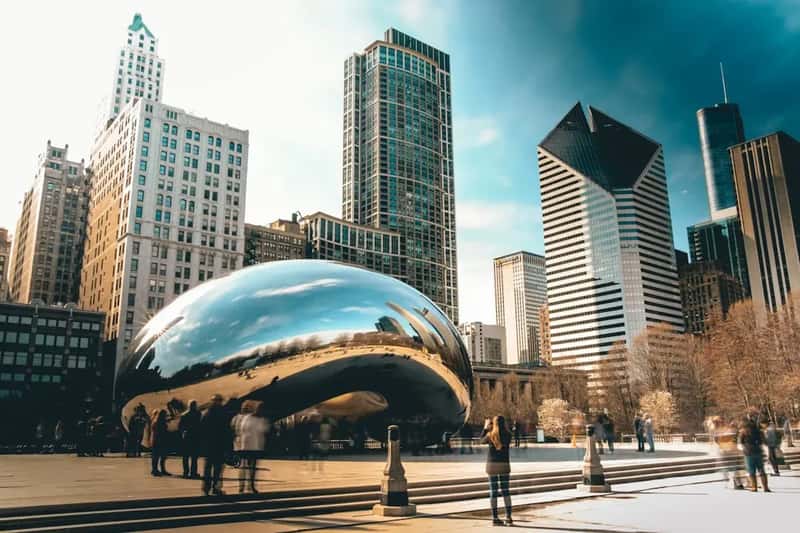
Chicago claimed the unfortunate title of 2025’s most traffic-congested city in the U.S. Traffic was so severe that the Windy City also ranked third worst globally, according to INRIX data. Drivers in Chicago lost 112 hours to traffic jams in 2025, compared to 102 in 2024, costing the average driver $2,063 and the city a staggering $7.5 billion.
During the worst parts of the morning and evening commutes, peak speeds in Chicago dropped to just 21 mph, while off-peak driving averaged 42 mph. For workers headed downtown, speeds during that last painful mile of the morning commute fell to a crawl of 9 mph in 2025. INRIX transportation analyst Bob Pishue explains part of why Chicago struggles so much: “Chicago has a funky geography because one direction is completely blocked off by water. Because of water, it’s just going to have transportation challenges.”
New York City: A Gridlock Giant Trying Something New

Drivers in New York City lost 102 hours to traffic jams in 2025, and those delays cost the average driver $1,879 while costing the city as a whole a remarkable $9.7 billion. Peak speeds in New York dropped to just 15 mph during the worst parts of the morning and afternoon rush hour, rising to 30 mph during off-peak periods and averaging 11 mph on downtown last-mile routes during the morning commute.
New York City began addressing its congestion issues by introducing congestion pricing. Drivers entering Manhattan’s congestion relief zone south of 60th Street are charged a once-per-day toll of $9 during peak hours on weekdays and between 9 a.m. and 9 p.m. on weekends, dropping to $2.25 overnight. Congestion levels in New York City remained flat in 2025, and the city’s new congestion pricing policy is considered a likely factor in its ability to hold the line.
Los Angeles: The Eternal Champion of Gridlock
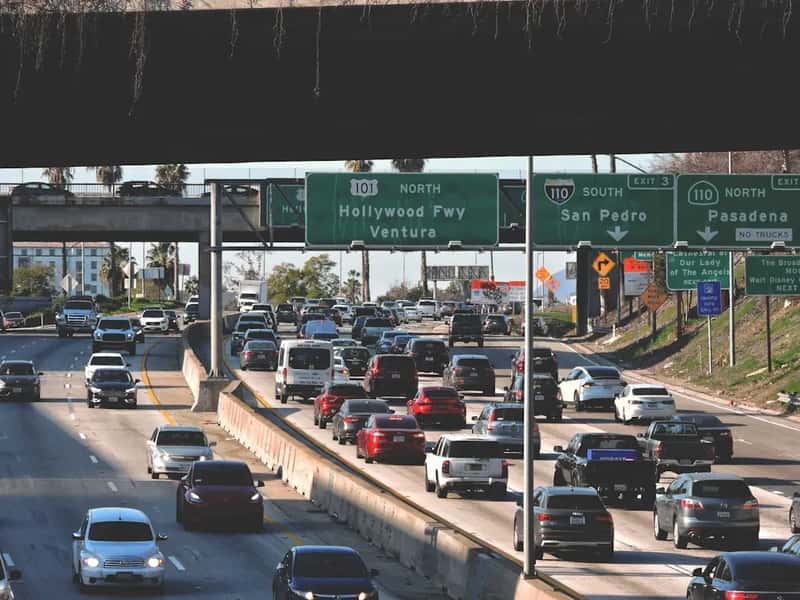
For decades, Los Angeles traffic has been a steady progression of worsening congestion. In 1982, the typical freeway commuter burned 61 hours a year in gridlock. By 2024, that total had ballooned to 137 hours – almost six full days lost to traffic. Greater Los Angeles, which includes the Long Beach and Anaheim metro areas, ranks first in the nation in terms of congestion, a distinction it has held for 43 of the past 44 years.
According to a TRIP report, traffic congestion in the Los Angeles area costs the average driver $3,478 annually in lost time and wasted fuel, with drivers wasting an average of 36 gallons of fuel each year due to congestion. UCLA professor of urban planning Brian Taylor puts it plainly: “We actually have modest levels of driving but a very large number of people on a relatively limited road system, and that results in high levels of congestion.”
Philadelphia: The Fastest-Rising Congestion Crisis
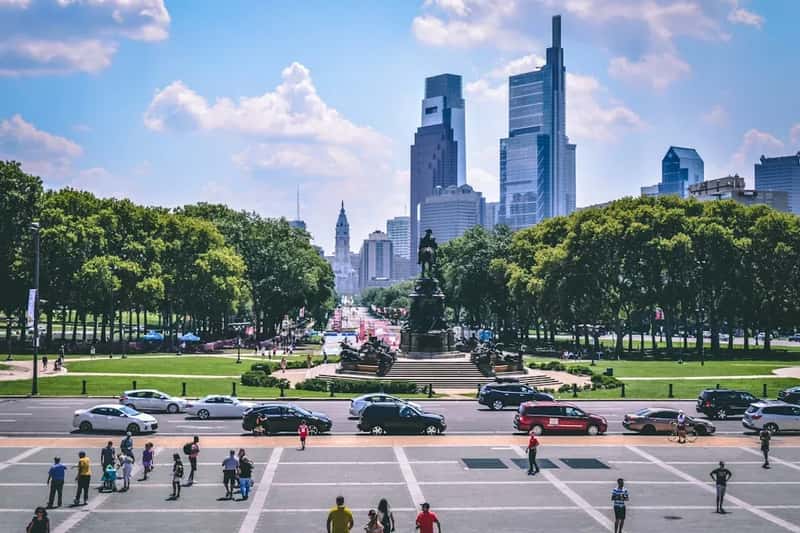
Philadelphia ranked third in the INRIX 2025 U.S. congestion rankings, with drivers losing 101 hours in 2025, up sharply from 77 hours in 2024 – a 31 percent increase – costing the average driver $1,860 and the city $4.4 billion. High commuter volumes and dense urban development push Philadelphia into one of the top spots for congestion in the country. According to TomTom, the city has an average congestion level of roughly 37.5 percent, and drivers lose around 72 hours during rush hour each year.
Philadelphia and Baltimore saw the largest year-over-year increases in congestion in the entire country at 31 percent in 2025. That kind of spike in a single year puts Philadelphia in rare and unfortunate company. The city’s combination of narrow historic streets, dense development, and heavy truck traffic through major freight corridors makes untangling the gridlock genuinely difficult – not just politically, but physically.
Boston and Miami: Compact Cities, Outsized Delays
Boston drivers lost 83 hours to traffic in 2025, costing them roughly $1,529 each and the city $2.9 billion in total, while downtown speeds averaged just 10 mph. Boston’s geography works against it in much the same way Chicago’s does – water hemming in the road network from multiple directions, with an older street grid that was never designed for the volume of modern traffic it now carries daily.
Miami ranked sixth on the INRIX 2025 list, with drivers losing 75 hours to traffic jams and bearing an individual cost of $1,381, with the city as a whole losing $3.5 billion. According to the TomTom Traffic Index, Miami’s average congestion level sits at nearly 47 percent, making it one of the most clogged cities in the country by that measure. Miami’s rapid population growth in recent years, with a surge of relocations from other states, has pushed an already strained road network toward a chronic breaking point.
Atlanta, Houston, and Washington D.C.: The Sun Belt and the Capital Feel the Squeeze
Atlanta drivers lost 75 hours to traffic in 2025, a 15 percent jump from the previous year, costing each driver $1,381 and the city $3.4 billion. Atlanta saw trips to its downtown core increase by roughly 10 percent year-over-year, part of a broader surge in downtown activity that pushed congestion higher across the Sun Belt. Houston, meanwhile, experienced a dramatic downtown surge of its own, with trips to its city core jumping by nearly a quarter in a single year according to INRIX data.
Washington D.C. drivers lost 70 hours to congestion in 2025, a 13 percent rise from 2024, with each driver bearing a cost of $1,289 and the regional cost reaching $3.2 billion. INRIX data for 2024 showed D.C. drivers losing 62 hours to congestion, meaning the capital’s commuters saw a meaningful deterioration even in just one year. For federal workers and contractors navigating the Beltway, that trend is very much felt every single morning.
Seattle and the Tech Corridor: Remote Work Didn’t Save Anyone
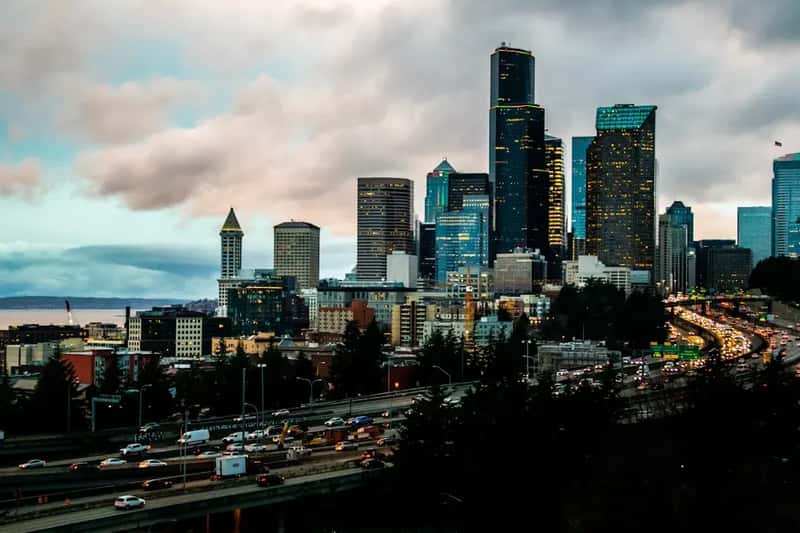
Seattle rounded out INRIX’s top ten most congested U.S. cities in 2025, with drivers losing 68 hours to traffic – an 8 percent increase from 2024 – at a cost of $1,252 per driver and $1.9 billion for the city overall. Seattle was widely expected to benefit from the tech industry’s embrace of remote work. The reality turned out to be more complicated. A pullback on fully remote arrangements among major employers brought more cars back downtown, and the city’s constrained geography made absorbing that additional volume nearly impossible.
The return to in-person work in tech-heavy areas like San Jose, San Francisco, and Seattle brought a large jump in downtown trips, undoing much of the pandemic-era relief these cities had briefly enjoyed. Public transit has not kept pace with returning commuters and is still down 22 percent from 2019 levels nationally, leaving many workers with no realistic alternative to getting behind the wheel. Seattle’s transit system, while improving, simply cannot absorb the daily surge on its own.
The Bigger Picture: Why Traffic Just Keeps Getting Worse
Americans lost an average of 63 hours sitting in traffic in 2024, the highest level ever measured according to the Texas A&M Transportation Institute’s Urban Mobility Report – equivalent to nearly eight full workdays, with national congestion costs totaling $269 billion annually. Researchers found that delays are no longer confined to traditional weekday rush hours; instead, they’re spreading to midday, midweek and even weekends. That shift matters because it means there is no longer a reliable “off-peak” window for many urban drivers to exploit.
Beyond growing travel demand, structural factors are intensifying congestion pressures. Rising housing costs are pushing many workers farther from job centers, fueling so-called “super commutes,” while billions in infrastructure spending have struggled to keep pace with demand. Aging bridges, major construction corridors, and delayed upgrades continue to amplify delays, particularly in fast-growing metro areas. Adding to the pressure in 2026, the FIFA World Cup is bringing massive amounts of traffic and fans from across the globe to host cities unaccustomed to that kind of surge, with Los Angeles already planning for the influx. The games will be a genuine test of how well American cities can manage extreme congestion under pressure.
The pattern is clear and consistent across every report, every data source, and every city on this list: traffic in America is getting worse, it is spreading across more hours of the day, and it is costing individuals and economies in ways that compound quietly over time. Solutions exist – congestion pricing, transit investment, smarter infrastructure spending – but they require political will that has historically been in shorter supply than the traffic itself.